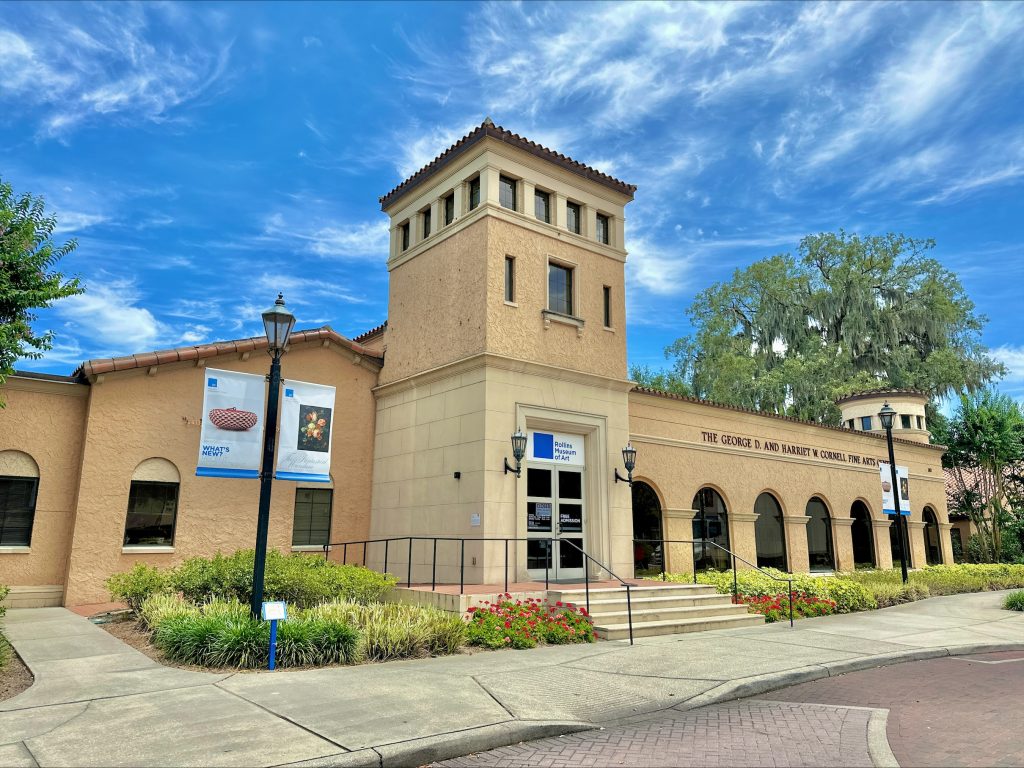
At Rollins Museum of Art (RMA), we’re always looking for new ways to better understand and connect with our visitors. This past year, we got to do just that in an exciting way when we teamed up with Rollins College students in the Marketing, Data Analytics, and Computer Science departments to explore new ideas for improving visitor experience.
The project started with a spark from RMA’s Bruce A. Beal Executive Director, Leslie Anderson, who recalled her own experience in business school.
“I was thinking of the projects I had in business school that were the most exciting. Typically, in academic art museums, we’re familiar and practiced in creating projects for art and art history and other areas of the humanities. I thought, there’s an opportunity for students in other disciplines to use the museum as fertile ground for their own research.”
What began as a multifaceted academic partnership has grown into a transformative project combining data, technology, and visitor experience in new and impactful ways.
Marketing Perspectives: Making Data Work for Us
As part of the broader project, Rollins College marketing student Michelle Burdett, conducted an exploratory review of our existing data. While this was a smaller component of the initiative, it provided valuable insights. Their analysis helped identify opportunities to better communicate what we do and provided practical recommendations for connecting with our audiences.
A key contribution came from Rollins College Data Analytics student Richard Stoiberer, who focused on our historical attendance data. Working under Rollins College Professor and Director of Data Analytics JJ Jasser, Stoiberer worked to develop a new, user-friendly program that allows us to visualize trends more clearly than ever before. This tool, which includes a specifically organized spreadsheet, uses Microsoft Power BI, an interactive data visualization software, to generate charts, graphs, and heat maps, transforming the raw data into accessible, actionable insights about visitor experience.
“This project gave our students the opportunity to apply data analytics in a real-world cultural environment,” shared Professor Jasser, “transforming anonymous movement data into meaningful insights about how visitors interact with exhibits and spaces. It was exciting to see technology used not to replace the museum experience, but to better understand and enhance it.”
With this system, our team can more easily track attendance patterns, identify peak times, and make informed decisions about programming and staffing moving forward.
Understanding the Visitor Journey
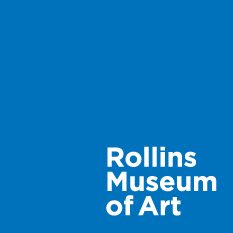
The most ambitious and innovative component of the project was completed at the end of the 2025-26 academic year. Computer Science students, Richard Stoiberer, Zubair Zabir, Stella Fruijtier, and Sydney Eckstein designed and implemented a new opt-in visitor tracking system within the Museum.
The Computer Science capstone course is guided by Rollins College Associate Professor and Chair of Computer Science, Valerie Summet, who builds in two simple but important expectations for the project:
- Students must learn something genuinely new
- Their projects need to do good in the world by creating some kind of positive social impact
- Their projects need to do good in the world by creating some kind of positive social impa
How the system works
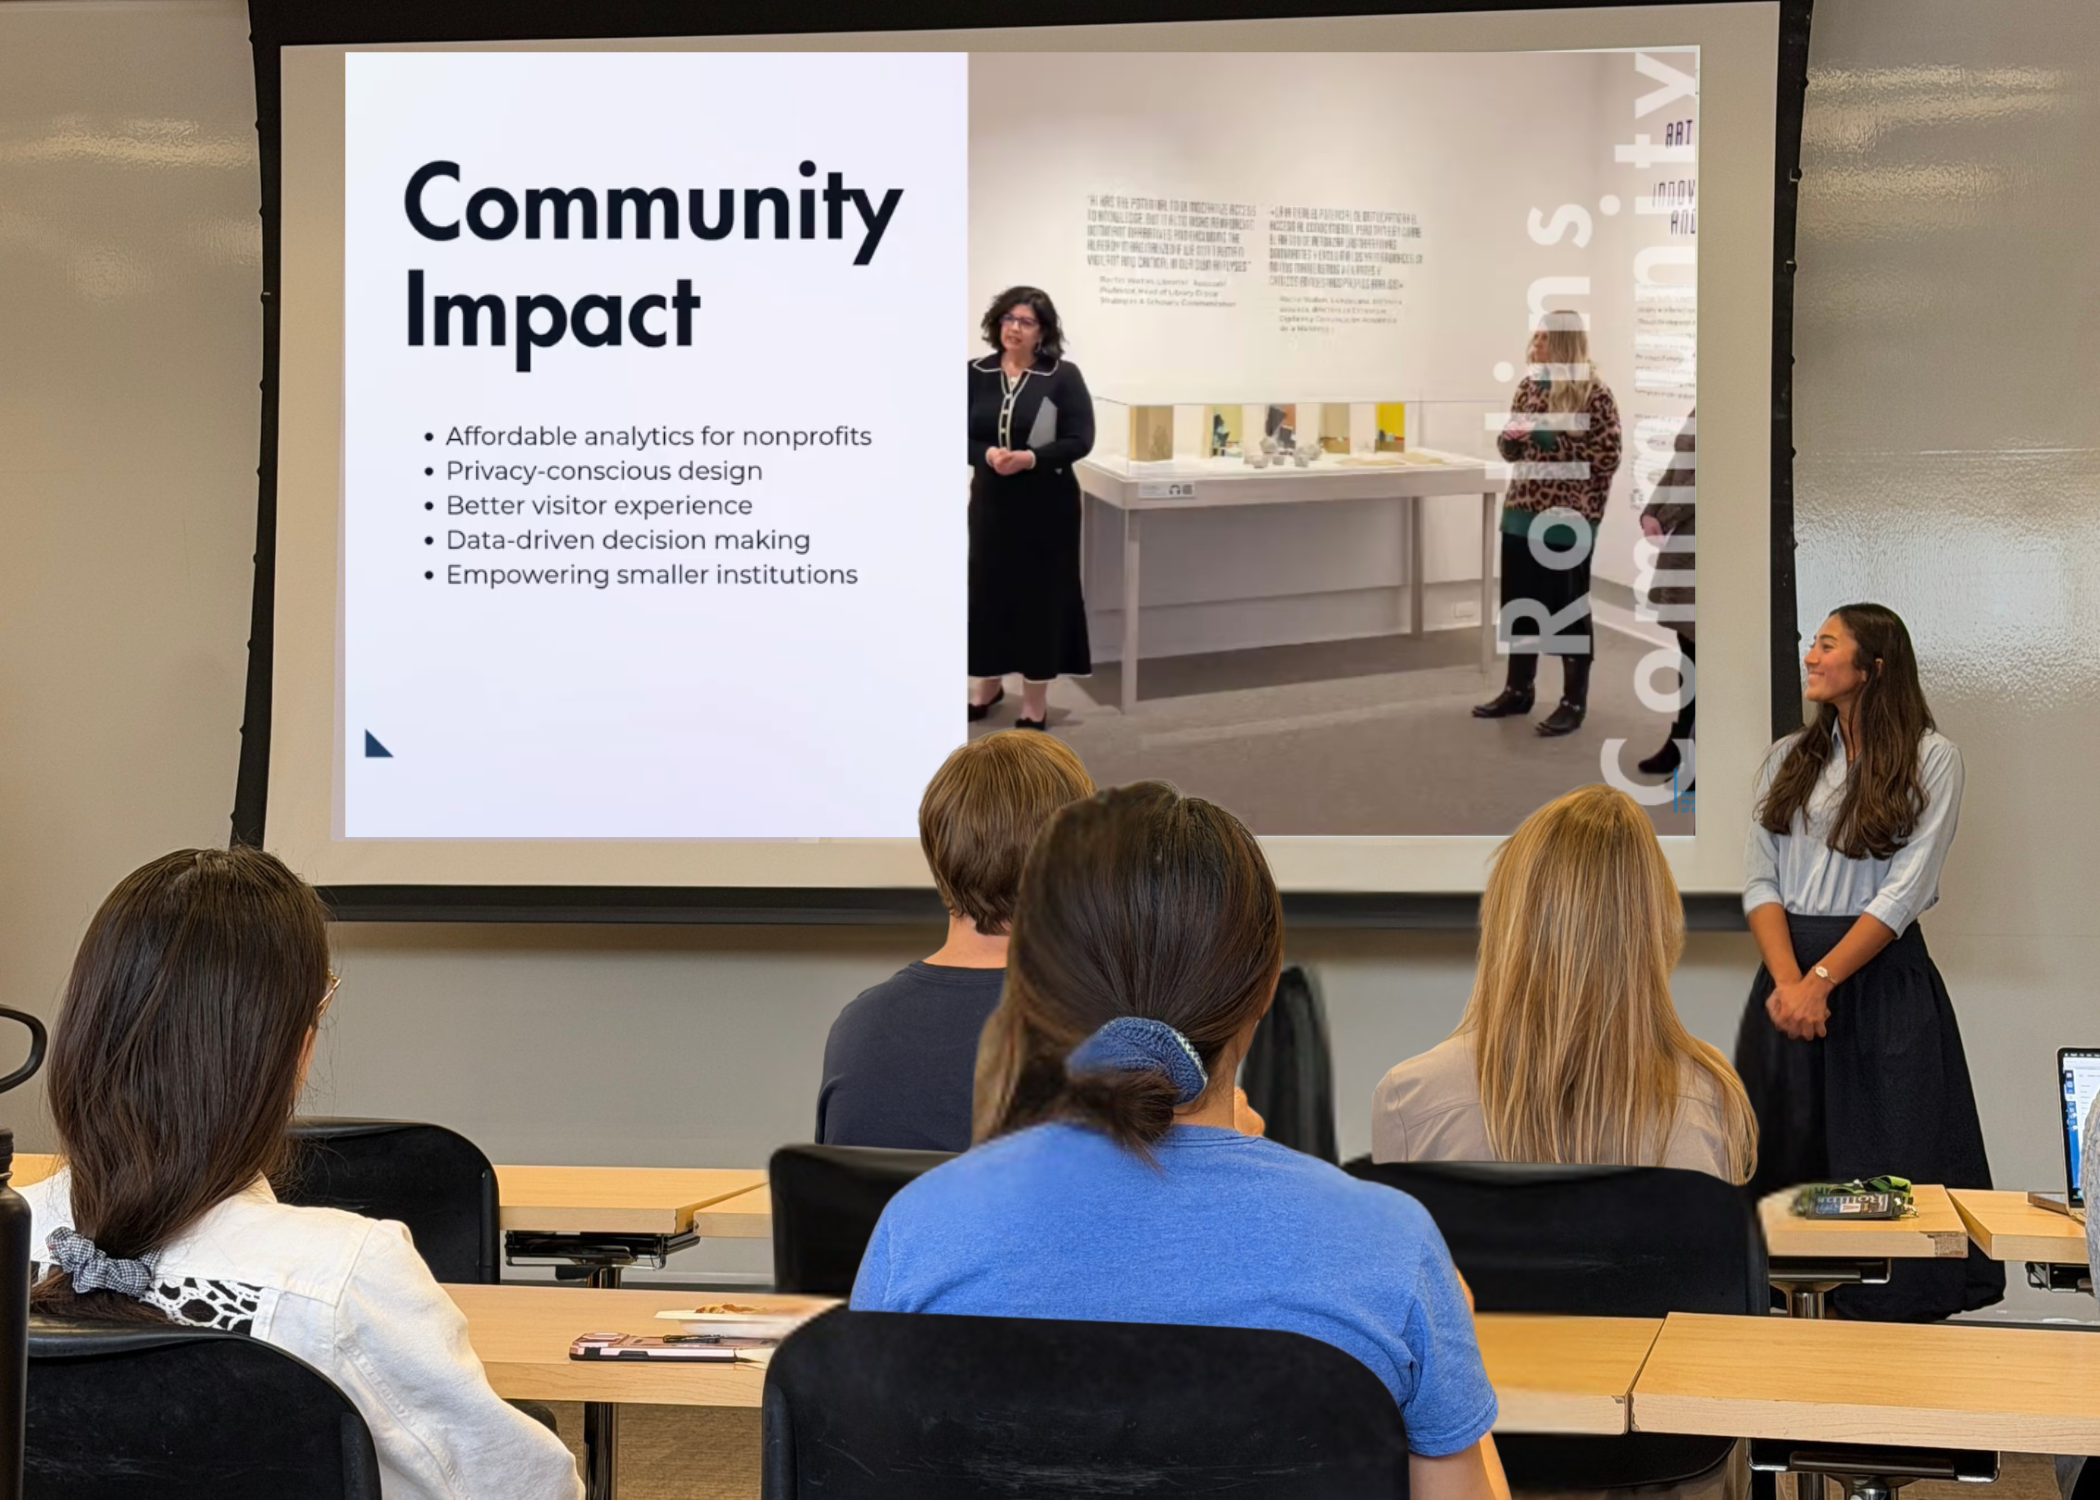
The system the students created offers museum visitors the option to wear small tracking devices during their visit. These devices allow RMA to anonymously map movement throughout the museum, helping us understand which exhibits attract the most attention, how long visitors engage with specific spaces, and how they navigate the building overall.
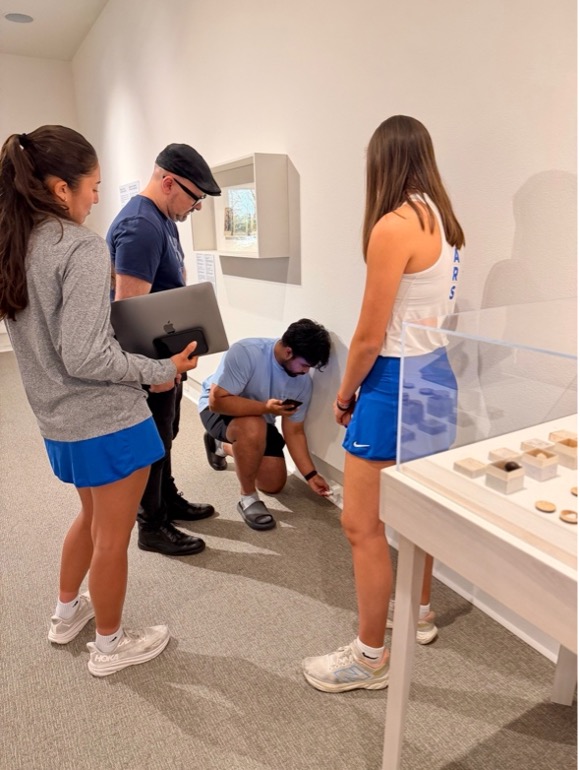
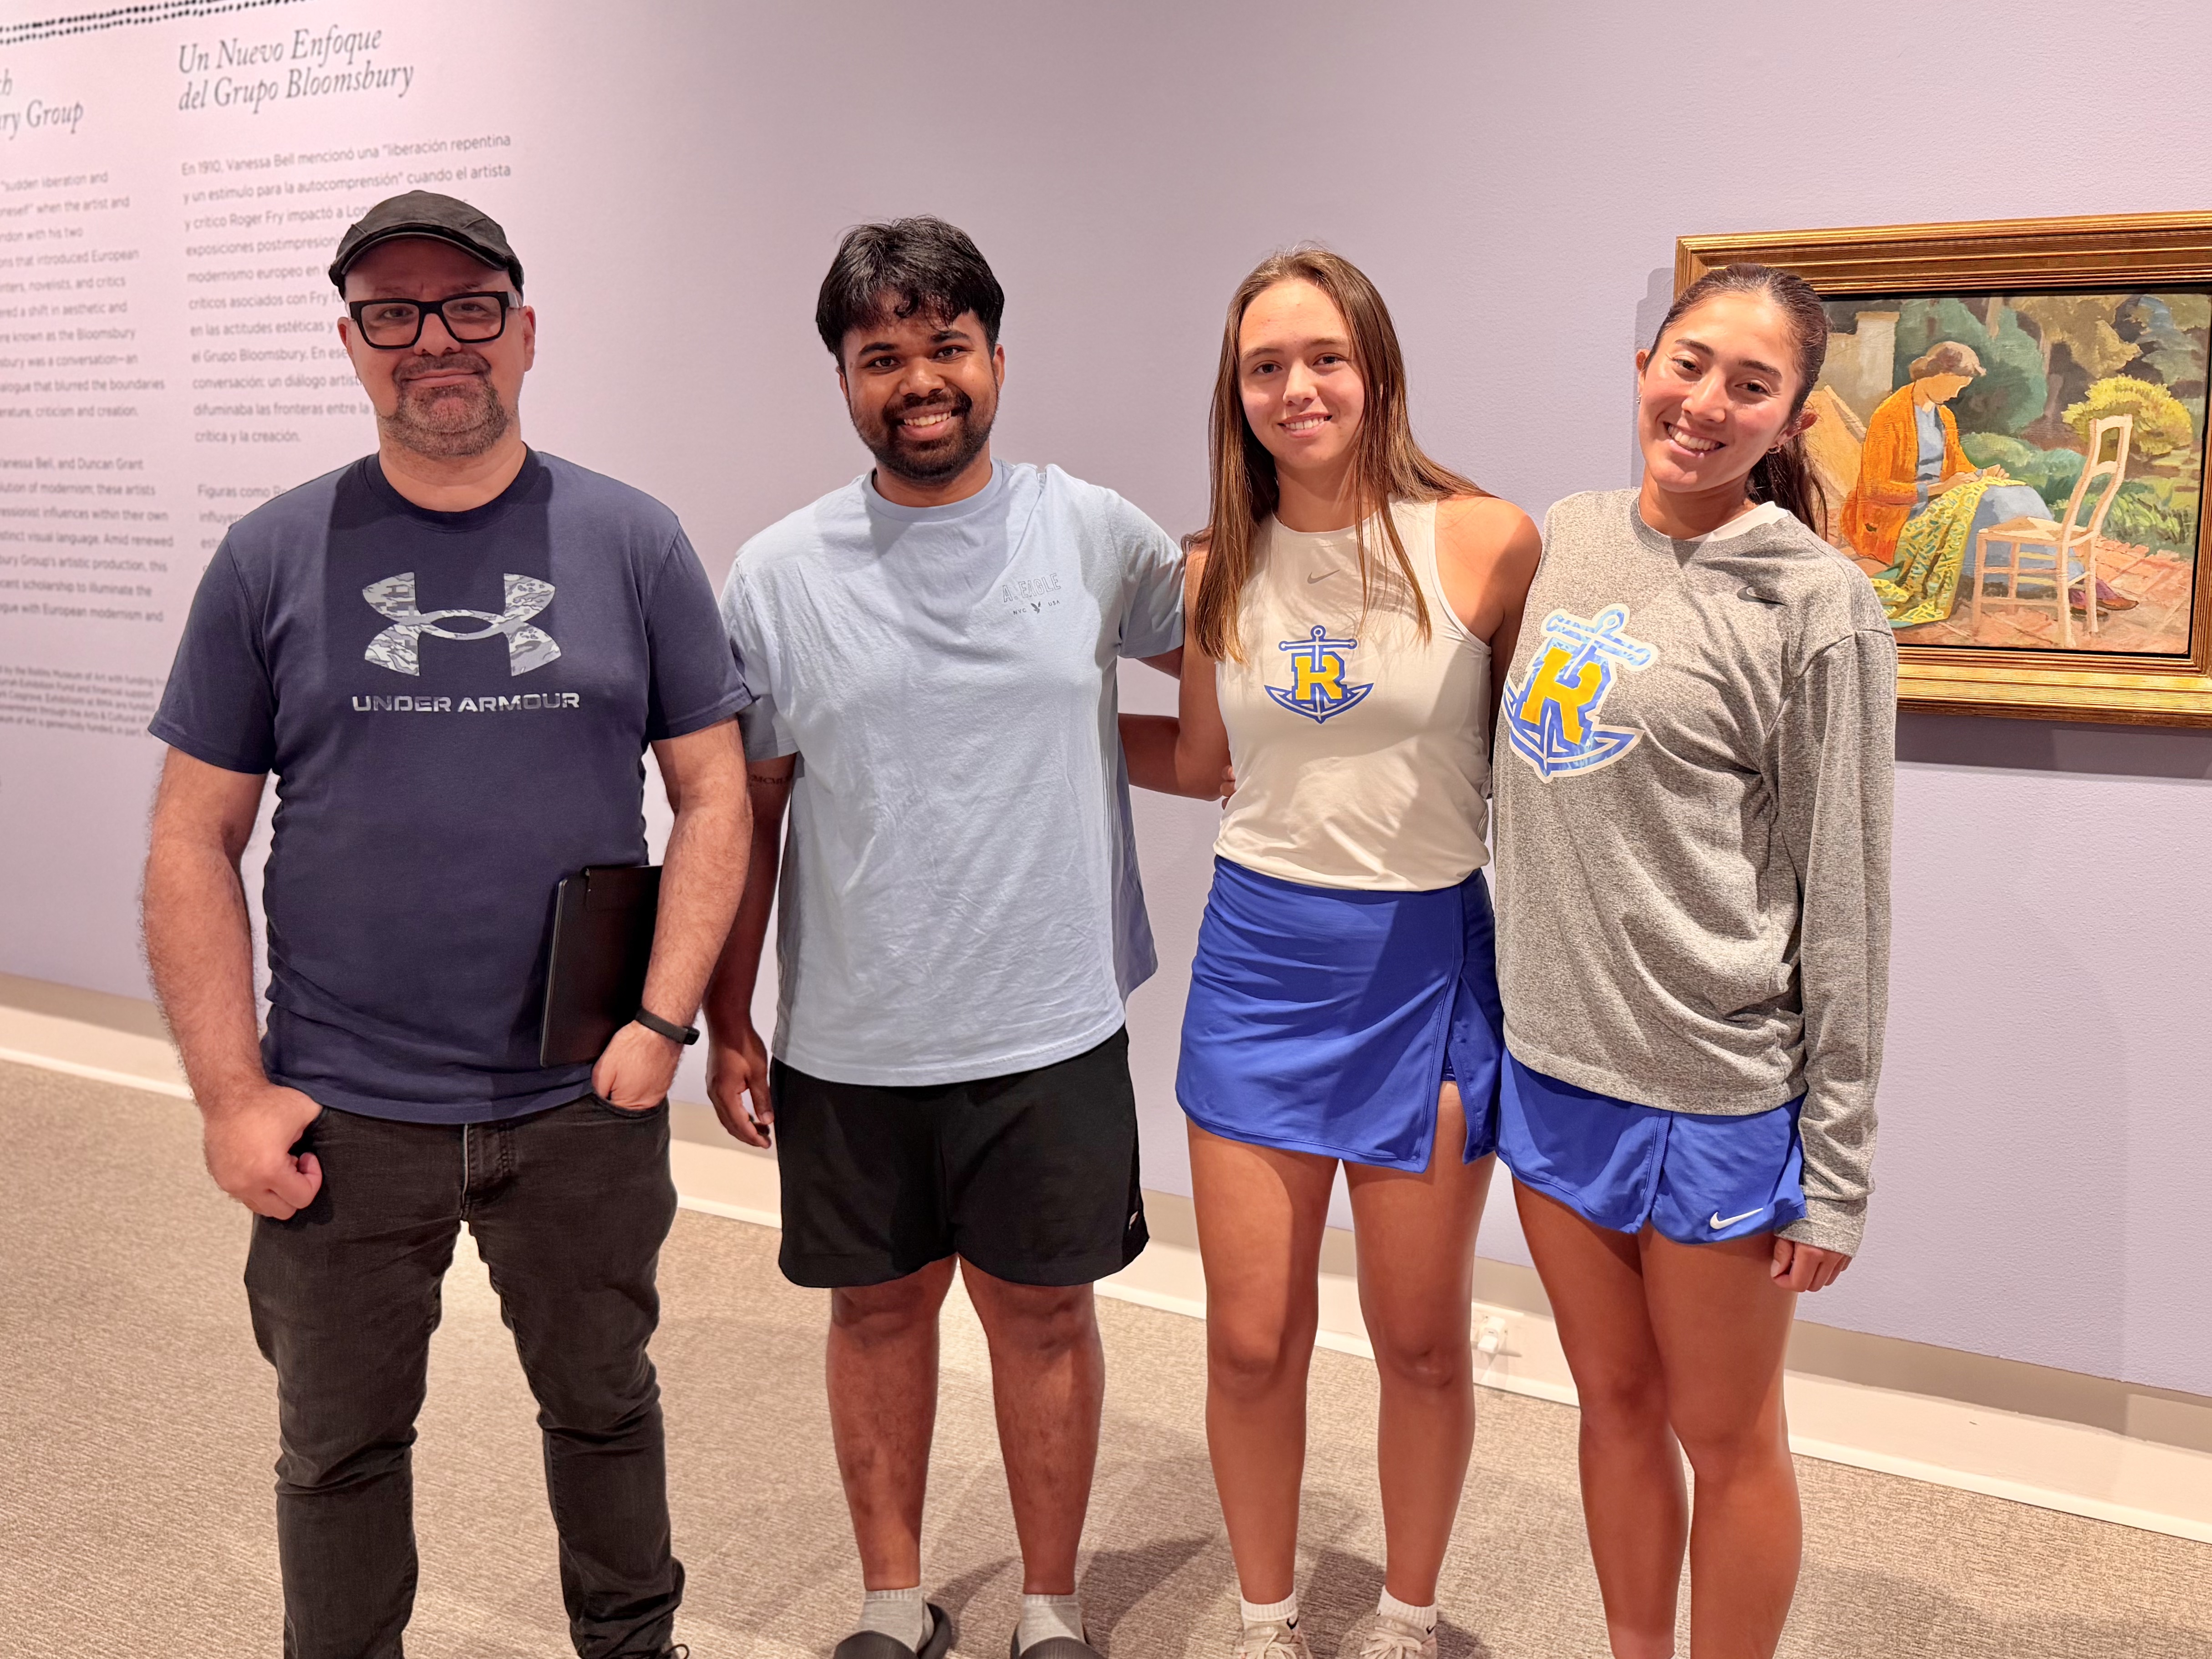
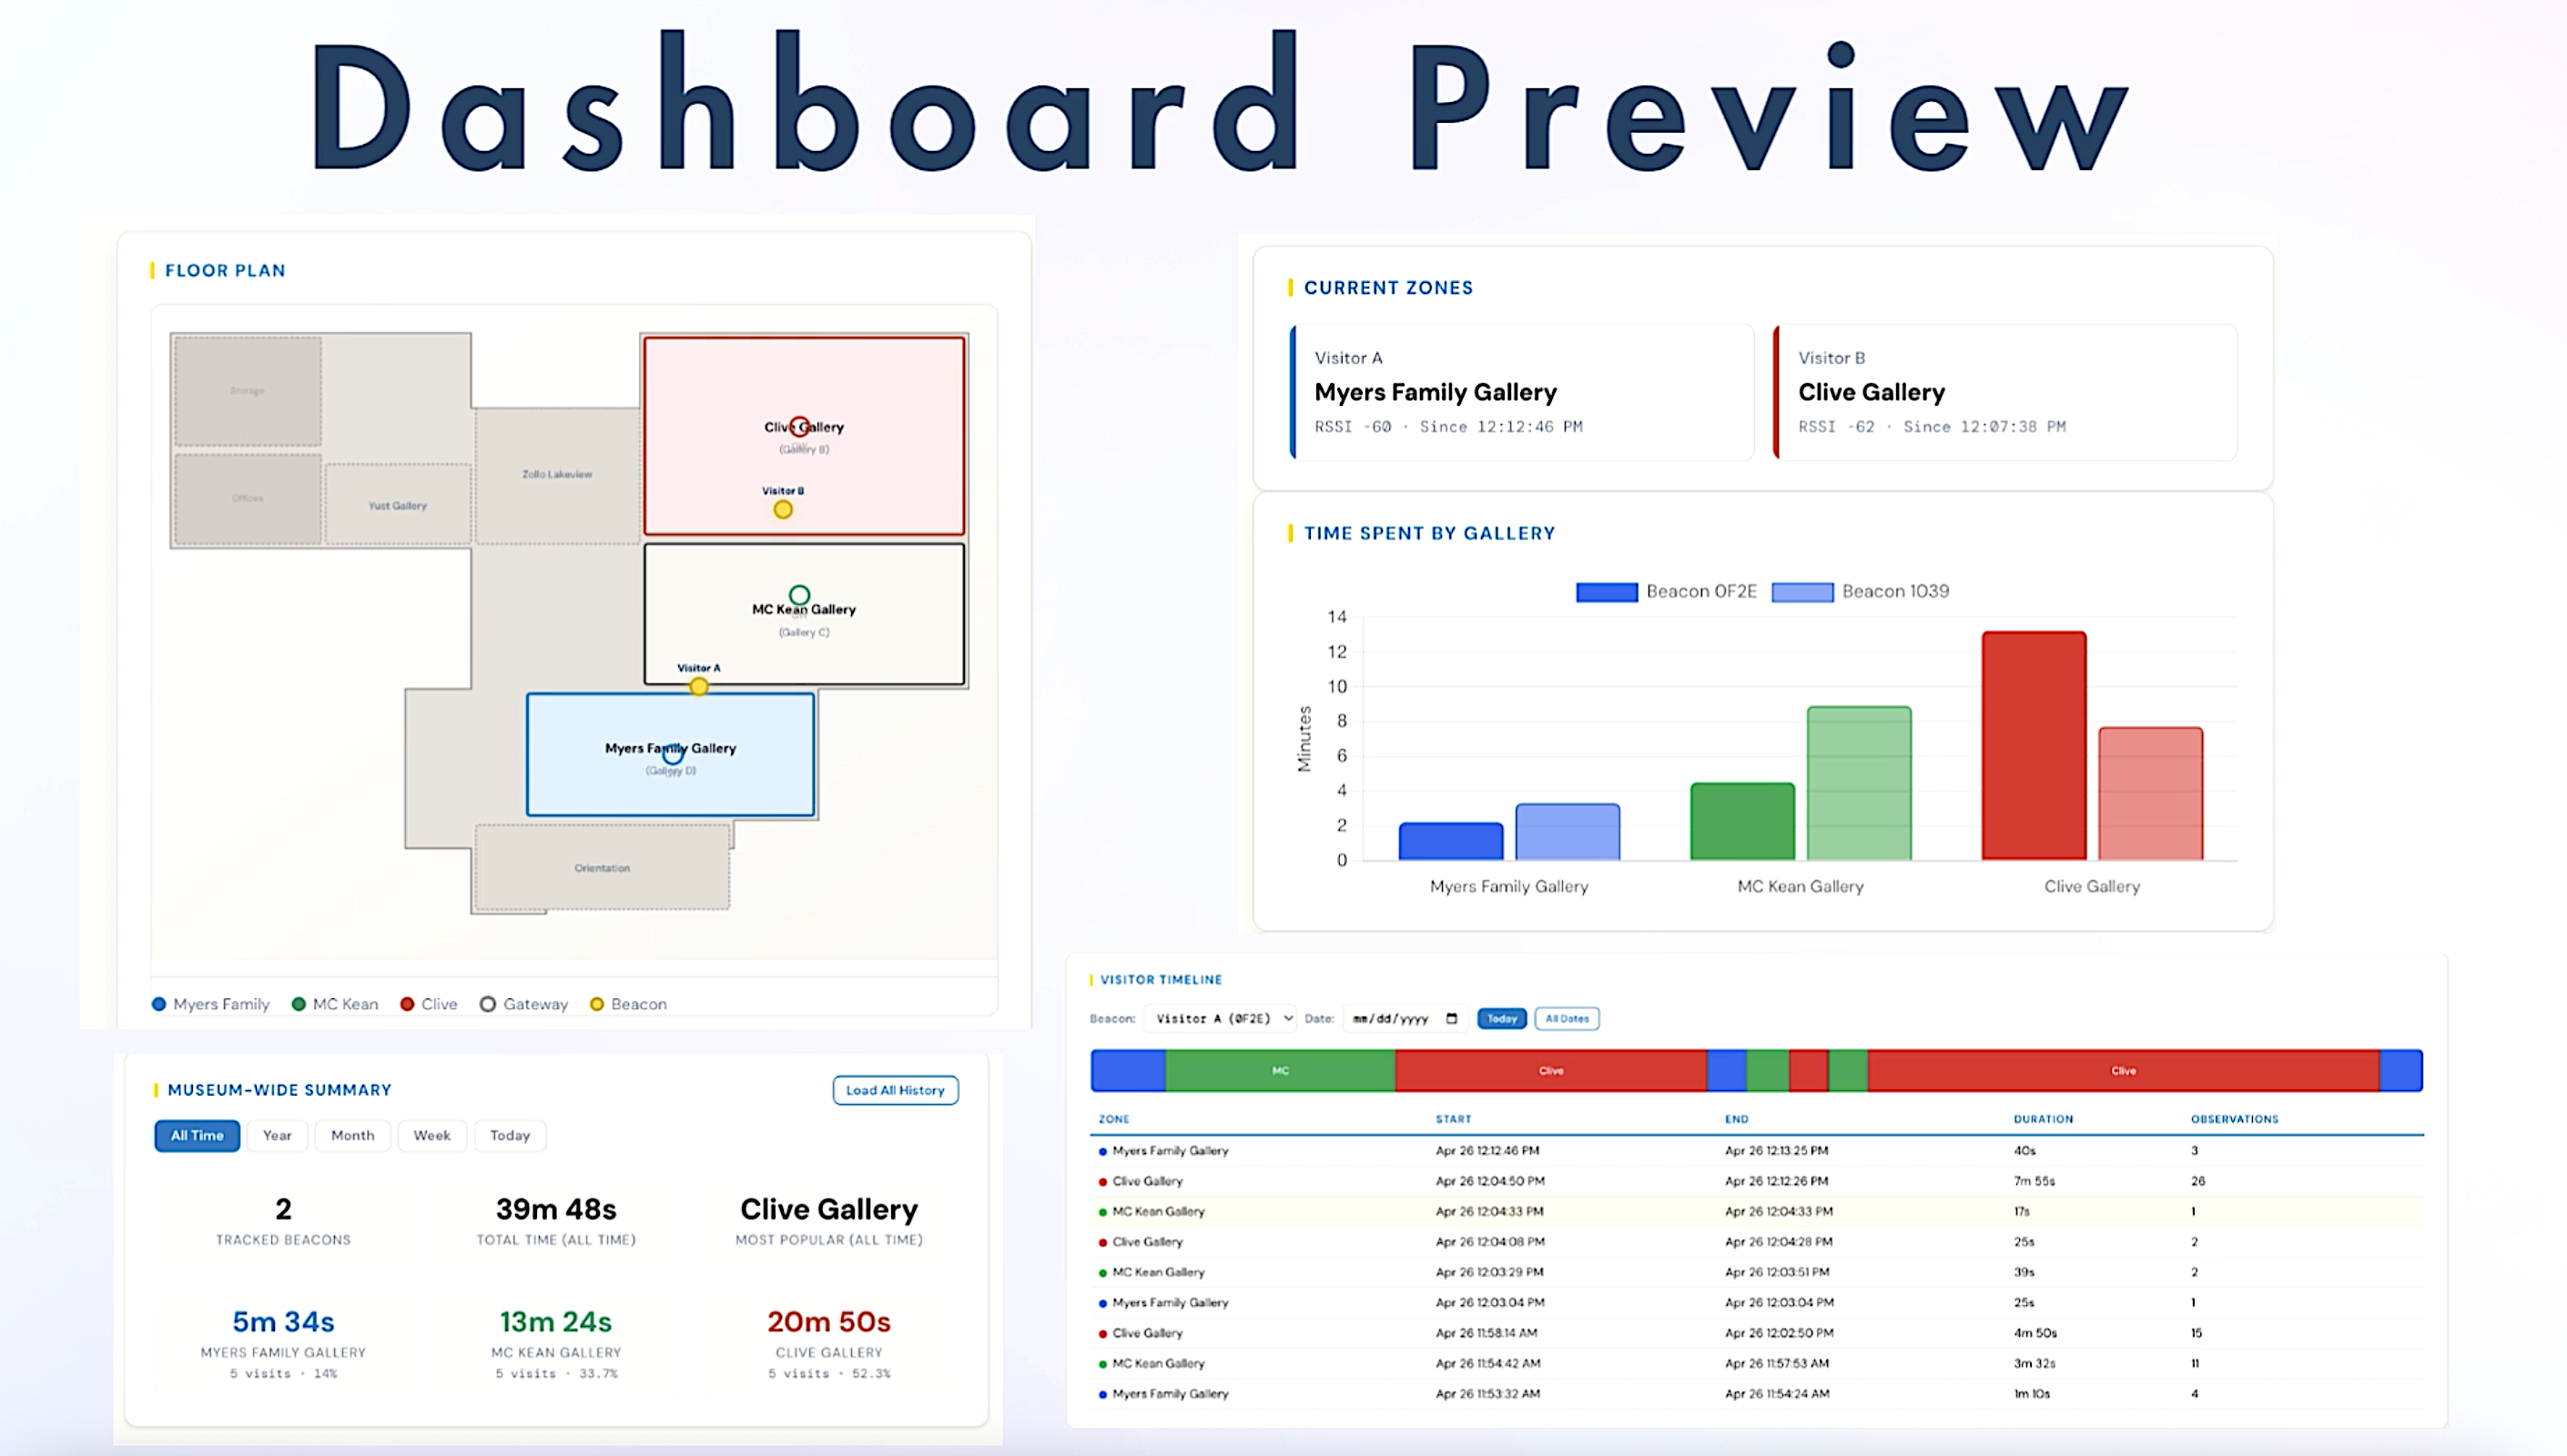
Behind the scenes, the system turns opt-in participation into useful insights while keeping privacy front and center. When visitors choose to participate, the system records general patterns, such as how people move through galleries or which exhibits they spend time in, without collecting personally identifying information. That data is securely stored and combined with input from other visitors to build a broader picture of how the museum is experienced day to day. The result is a dashboard tool that helps staff better understand what’s working in the galleries, while respecting each visitor’s choice and anonymity.
Importantly, this initiative is entirely voluntary and designed with visitor privacy in mind. The goal is not to track individuals, but to better understand collective behavior to enhance the museum experience.
We are incredibly grateful for their dedication and ingenuity, and we look forward to continuing to build on this foundation as we shape the future of Rollins Museum of Art. Stay tuned as we begin to implement these new tools and share what we learn along the way.
Watch the students’ capstone presentation to learn more about their process and findings.
Enjoy Free Admission to Rollins Museum of Art
Visit Rollins Museum of Art Tuesday – Sunday with Free Admission.